The world’s fifth-largest contract chipmaker, built from AMD’s fabs, Chartered Semiconductor and IBM Microelectronics, and now repositioned around specialty technologies such as silicon photonics, RF and power.
- Headquarters
- Malta, New York
- Founded
- March 2009, AMD spin-off
- CEO
- Tim Breen (since Apr 2025)
- FY2025 revenue
- $6.79B
- Fabs
- Dresden · Singapore · Malta · Burlington
- Installed capacity
- ~2.8M wafers/yr (300mm-eq.)
- Foundry share, Q2’26
- 3.2% · ranked #5
- Controlling holder
- Mubadala (81% at end-2025)
Latest developments
Selected to run two new Malta fabs funded by Japan Major
Under a U.S.–Japan initiative worth up to $21B, Japan funds two new 300mm fabs at GF’s Malta campus while GF supplies the technology and runs them. The first (about $10B) is due online in 2029; each fab is planned at roughly 900k wafers a year. GF will redirect $955M of its CHIPS award to silicon photonics, SiGe and advanced packaging, and the Commerce Department is to receive about a 4% equity stake. GM described a first direct automaker-to-foundry supply deal; Apple, Renesas and Tokyo Electron were also named.16 Shares rose about 5% intraday, to near $49.17
Q2 2026 beat guidance; data-center outlook raised
Revenue of $1.786B (+6% YoY) and non-IFRS gross margin of 29.9% topped guidance. Communications Infrastructure & Datacenter grew 62%, and management now expects that end market to grow 50–60% in 2026 with silicon photonics revenue more than doubling. Q3 guidance: $1.885B ± $25M revenue, non-IFRS EPS $0.51 ± $0.05.1,21
First dividend, photonics award, power IP deal
GF paid its first quarterly dividend ($0.12/share) on 14 July and declared another for 9 October. It signed a letter of intent for a $300M Commerce award for silicon photonics and closed the purchase of Photeon Technologies’ integrated voltage regulator business.1
Synopsys ARC processor IP acquired $440M cash
Combined with MIPS (bought in 2025), the ARC-V, ARC NPX/VPX and ASIP tool lines make GF a RISC-V IP vendor as well as a manufacturer.2
Quantum Technology Solutions launched
A new business to manufacture quantum hardware (processors, cryo-CMOS control chips, interconnects), backed by a planned $375M Commerce grant; the department receives an equity stake of about 1%.15
History
GlobalFoundries was assembled by acquisition. Abu Dhabi’s Mubadala funded AMD’s exit from manufacturing, then bought Singapore’s Chartered Semiconductor and took over IBM’s chip plants, creating a foundry with sites on three continents.
The company spent its first decade chasing the leading edge against TSMC and Samsung. In 2018, under new CEO Tom Caulfield, it abandoned 7nm development and refocused on what it calls differentiated, “pervasive” technologies: mature-node platforms with features such as RF, embedded memory, power and photonics that customers design into long-lived products. It sold non-core fabs, returned to profitability, and listed on Nasdaq in October 2021.
- Formation
- 2008
AMD decides to go fabless
AMD announces it will spin off manufacturing into “The Foundry Company”, a joint venture majority-owned by Mubadala’s ATIC (about 66%).
- 2009
GlobalFoundries is born
Launched in March with AMD’s Dresden fabs and the Malta, NY fab project. In September, ATIC agrees to buy Chartered Semiconductor for about US$1.8B.
- 2010
Chartered folded in
Then the third-largest foundry by revenue, Chartered becomes GF’s Singapore manufacturing hub.
- 2012
AMD exits
AMD sells its last 14% stake, leaving Mubadala as sole owner.
- Scale and the leading-edge race
- 2015
IBM Microelectronics acquired
IBM pays GF about $1.5B to take its chip business, adding fabs in New York and Vermont and more than 2,000 IBM engineers. GF also launches 22FDX, the first 22nm FD-SOI platform, in Dresden.
- 2017
Fab 8 ramps
Malta, NY becomes GF’s most advanced site (14/12nm FinFET).
- Pivot and public listing
- 2018
Leading-edge retreat
Caulfield becomes CEO; GF halts 7nm and refocuses on specialty platforms. Three non-core assets are later sold, including the East Fishkill fab to ON Semiconductor (closed end-2022).
- 2019
AMD agreement loosened
An amended wafer supply agreement lets AMD buy 7nm-and-below wafers anywhere.
- 2021
Nasdaq IPO
Shares list as GFS on 28 October; GF announces a Singapore fab expansion (Module 7H) and a new Malta fab plan amid the chip shortage.
- 2022
Record year
Revenue peaks at $8.1B and net income at $1.4B.
- Downcycle, CHIPS Act and reinvention
- 2024
CHIPS award, impairment
U.S. Commerce agrees up to $1.5B in CHIPS funding for Malta and Vermont. A $935M non-cash impairment drives a full-year net loss.
- 2025
New CEO, new businesses
Tim Breen succeeds Caulfield (April). GF pledges $16B of U.S. investment, buys MIPS (RISC-V IP), AMF (Singapore silicon photonics) and InfiniLink, signs a “China-for-China” foundry partnership and plans a €1.1B Dresden expansion.
- 2026
AI networking and allied-nation fabs
Synopsys ARC IP deal, Tower Semiconductor patent suits, quantum business launch, first dividend, and the Japan-funded two-fab plan for Malta.
Management & ownership
Leadership passed to Tim Breen in April 2025 after a multi-year succession plan; Tom Caulfield, CEO since 2018, became Executive Chairman. Breen joined GF in 2018 and was COO before becoming CEO. He previously held senior roles at Mubadala and was a McKinsey partner. Under him GF has leaned on acquisitions, IP licensing and government partnerships. Niels Anderskouv, named President and COO in the same transition, left on 2 March 2026; his duties were absorbed by Breen and the executive team.
Executive team
CEO since 28 Apr 2025; GF COO before that. Ex-Mubadala executive, former McKinsey partner.
CEO 2018–2025. Led the leading-edge exit, the return to profit and the 2021 IPO.
Interim CFO during 2025 (previously SVP Business Finance & Operations); now CFO and signs SEC filings.
Leads the technology roadmap; GF’s spokesman on the Tower patent case.
Runs the global fab network.
Customer and sales organisation.
Corporate strategy.
M&A: MIPS, AMF, InfiniLink, ARC, Photeon.
Legal and compliance.
Human resources.
Runs the processor-IP subsidiary.
Heads of the three product business units.
Board
Eleven directors: Caulfield (Executive Chairman), Breen, David Kerko (Lead Independent Director), Marc Antaki, Glenda Dorchak, Samer Halawa, Camilla Languille, Jack Lazar, Ganesh Moorthy, Carlos Obeid and Bobby Yerramilli-Rao.10
Ownership
Mubadala held 81.0% at 31 Dec 2025. In March 2026 it sold 20M shares at $42 and GF bought back another 7.3M from it for $300M, which by our arithmetic leaves Mubadala near 77%.4,13 The U.S. Commerce Department is set to take stakes of about 1% (quantum award) and about 4% (Japan fab deal).15,16 As a controlled company and foreign private issuer, GF has lighter governance requirements than a typical U.S. listing.
Products & services
GF is a pure-play foundry: customers design chips and GF manufactures the wafers. It serves more than 200 customers, from fabless chip designers to automakers. Since January 2026 it reports two revenue types. Manufacturing Services (about 89% of revenue) is volume wafer production. Technology Services covers engineering (NRE), masks, qualification, bump, test and packaging, and IP licences and royalties, a line that grows as the MIPS and ARC businesses scale.
Revenue by end market, Q2 2026
Year-over-year change by end market, Q2 2026
| End market | What GF makes for it | 2026 direction (management) |
|---|---|---|
| Smart Mobile Devices | RF front-end (RF-SOI switches, LNAs), power management, display drivers, connectivity | Down low-teens %: handset builds cut on memory prices and shortages |
| Communications Infrastructure & Datacenter | Silicon-photonics transceivers, SiGe drivers and TIAs for optical links, wireless infrastructure, satellite comms, storage | Up 50–60%; silicon photonics revenue more than doubling; SiGe capacity oversubscribed through 2027 |
| Automotive | MCUs, radar, battery management, smart sensors, power, in-vehicle networking | Up low double digits, weighted to Q4 after a customer timing shift |
| Home & Industrial IoT | Low-power connectivity, sensing, tracking, displays, aerospace & defense parts | Outlook raised after Q2 grew 10% |
| Technology Services | NRE, masks/reticles, packaging and test, IP licensing and royalties (MIPS, ARC) | Up 21% in Q2 |
New lines of business since 2025
Processor IP. MIPS ($215M cash, closed Aug 2025) plus Synopsys’ ARC line ($440M, closed Jun 2026) give GF RISC-V cores, NPUs, DSPs and processor-design tools to license, aimed at “physical AI” in cars, robots and industrial gear.2
Silicon photonics at scale. The Advanced Micro Foundry purchase ($453M, Nov 2025) adds a dedicated Singapore photonics fab; InfiniLink ($48M) adds an optical-transceiver design team in Egypt.2,3
Power for AI data centers. A long-term GaN partnership with Navitas (Nov 2025) and the Photeon integrated-voltage-regulator purchase (Jul 2026) build on GF’s BCD and GaN processes.1,3
Quantum. Quantum Technology Solutions (May 2026) manufactures parts for several qubit types, with Google, Microsoft, NVIDIA, PsiQuantum and Quantinuum among the named supporters.15
Technology & competitive strengths
| Platform | Node range | Why customers use it |
|---|---|---|
| FinFET (12LP / 12LP+) | 14–12nm | GF’s highest-performance logic; built in Malta. Used where performance matters but leading-edge cost does not pay. |
| FD-SOI (22FDX, 22FDX+) | 22nm | Fully depleted silicon-on-insulator: very low power and leakage, body-biasing, strong RF/mmWave. IoT, 5G, automotive radar, satellite links. Made in Dresden and Malta. |
| RF-SOI | 130–45nm | RF switches and front-end modules found in most smartphones. |
| Silicon germanium (SiGe) | 130–90nm | High-speed bipolar transistors for optical drivers/TIAs, mmWave and satellite. Inherited from IBM; expanding in Vermont. |
| Silicon photonics | 90–45nm | Optical transceivers on 300mm wafers, including monolithic designs with electronics on the same die; pluggables today, co-packaged optics next. |
| BCD / BCDLite, high-voltage | 180–40nm | Power-management ICs, gate drivers, display drivers. Now extended with GaN and integrated voltage regulators. |
| GaN (power and RF) | 200mm | Efficient power conversion for data centers and EVs; Vermont fab being converted, Navitas partnership. |
| Mainstream CMOS + eNVM | 180–28nm | Mixed-signal, MCUs with embedded non-volatile memory, sensors. |
Node ranges are indicative, compiled from GF filings and its multi-project-wafer listings with Europractice.25,27
Strengths
- Single-source designsGF targets products that can only be built on its processes without a costly redesign, which makes revenue sticky.
- Footprint outside Taiwan and ChinaLarge-scale fabs in the U.S., Germany and Singapore suit customers dual-sourcing for geopolitical risk.
- Government partnerDoD-accredited Trusted Foundry; CHIPS awards, New York State support, an R&D award pipeline and now Japanese capital for new fabs.
- Photonics and SiGe leadThe AI optical-networking boom lands on IBM-heritage SiGe and GF’s 300mm photonics; Comms & Datacenter grew 62% in Q2 2026.
- IP portfolioAbout 8,500 patents worldwide; now asserted against Tower Semiconductor (11 patents, ITC investigation opened Apr 2026).25,14
- Net cash balance sheet$3.3B cash and securities against $1.1B of debt at 30 Jun 2026.2
Weaknesses and risks
- Scale gap3.2% of foundry revenue against TSMC’s 72.5%; SMIC and UMC compete hard on mature nodes.20
- Pricing pressureAverage selling prices fell 10.4% in 2025; Chinese mature-node capacity keeps building.4
- Customer concentrationTop ten customers took 63% of 2025 wafer volume.4
- Supply dependenceSoitec supplied about 71% of 2025 SOI-wafer spend.4
- Strings attachedGrant milestones and restrictions on capacity abroad, dividends and buybacks; government equity stakes dilute holders.
- Controls and controlMaterial weaknesses in financial reporting controls; Mubadala’s majority limits minority influence.
Top-five foundries by revenue share, Q2 2026
Other competitors named in GF’s annual report: HuaHong, Tower Semiconductor, Vanguard (VIS), PSMC, X-FAB, plus foundry arms of Samsung, Intel and Texas Instruments.4
Global footprint
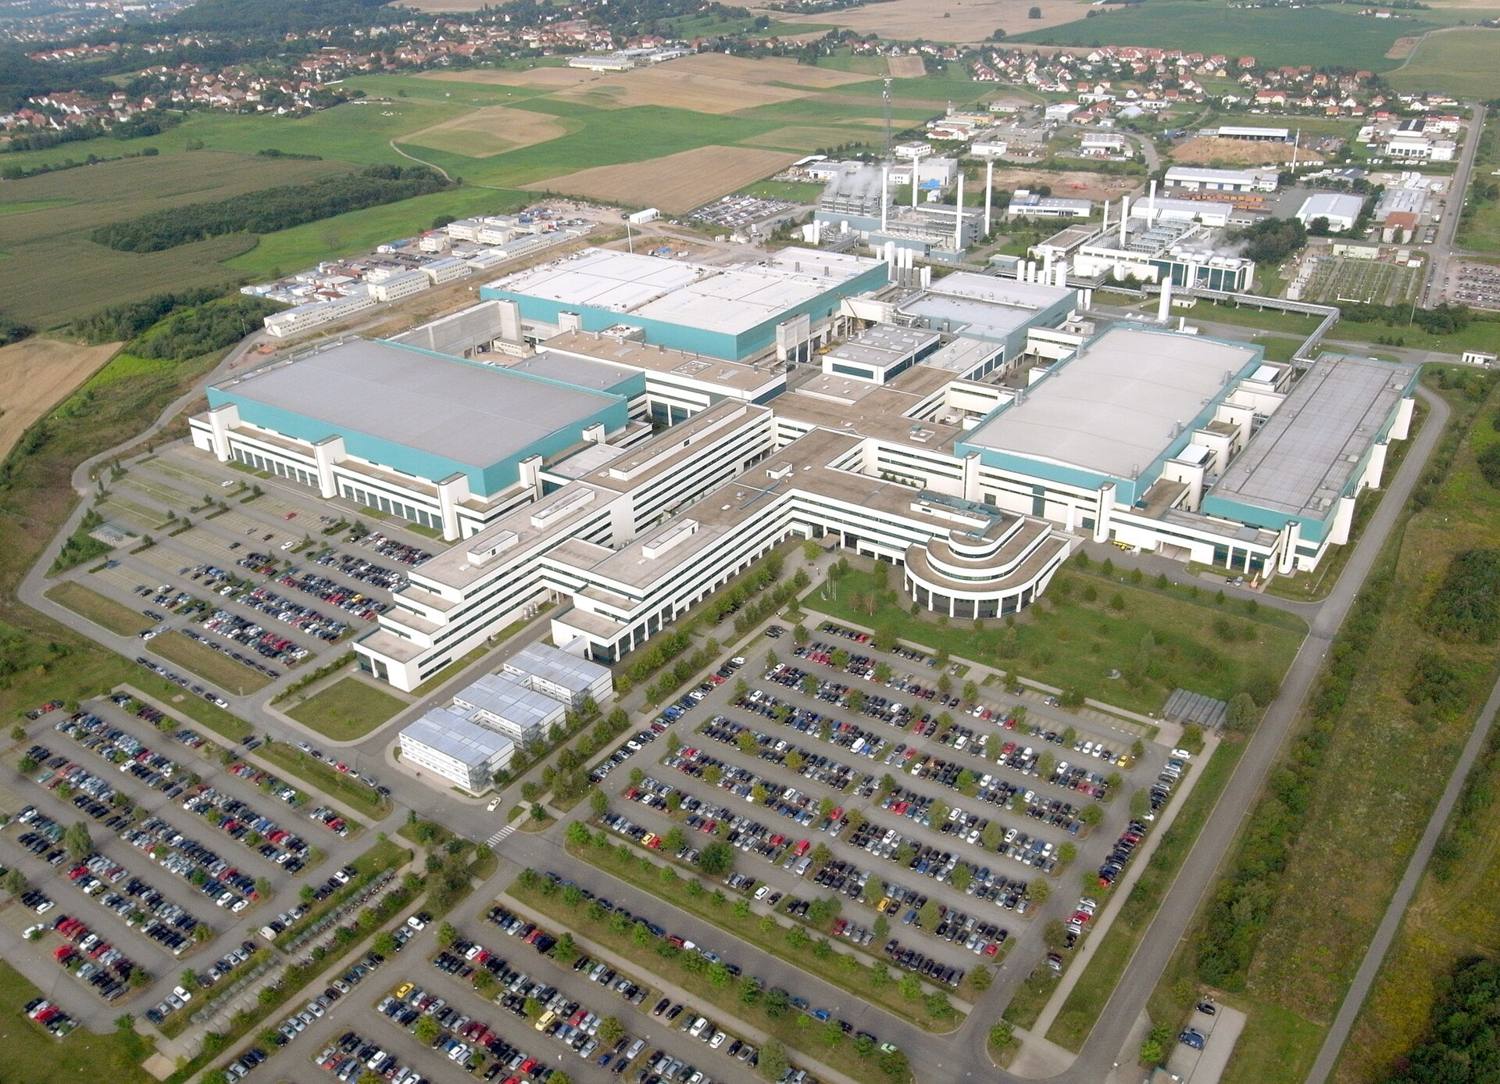
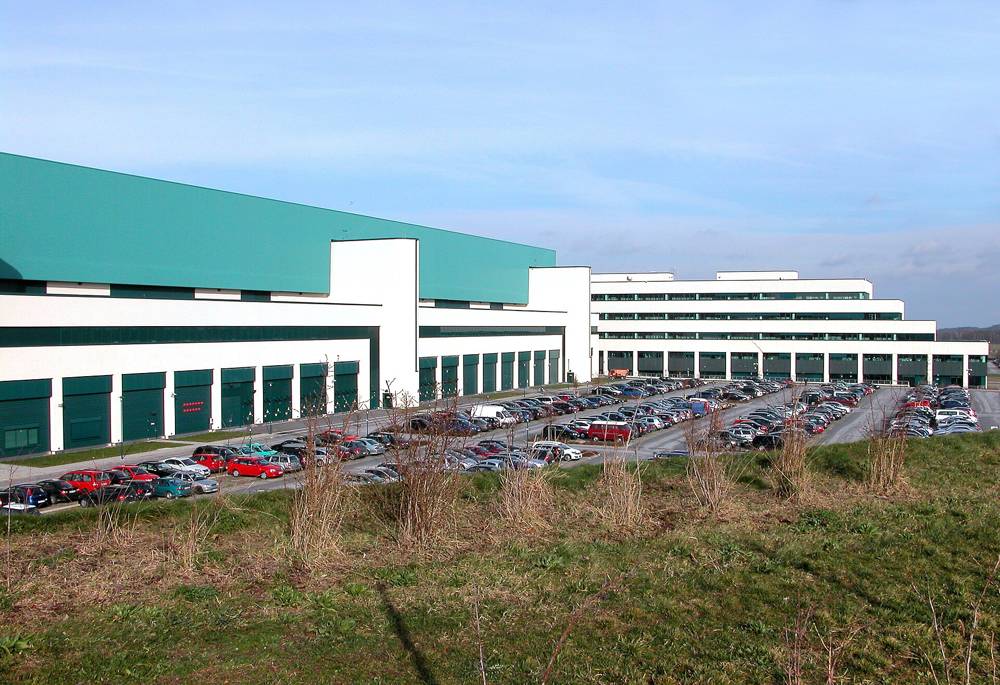
GF runs four manufacturing sites with more than 7,000 tools and about 2.8 million 300mm-equivalent wafers of installed annual capacity at end-2025. It also has design, engineering and support teams in India, Japan, Taiwan, Europe and the U.S., and a partner-operated line in China. About 14,000 people work for the company, roughly 70% of them engineers or technicians.4
| Site | Wafer | Main technologies | Capacity* | Expansion and funding |
|---|---|---|---|---|
| Dresden, GermanyFab 1 · ex-AMD | 300mm | 22FDX, eNVM, high-voltage/DDI, BCDLite (55–22nm) | ~700k | Project SPRINT: €1.1B expansion, contingent on EU Chips Act support, with EU-controlled secure flows |
| Singaporeex-Chartered · several fabs | 200 + 300mm | BCD, high-voltage, eNVM, display drivers, RF-SOI, SiGe; AMF photonics fab | ~1,060k + 450k (7H) | Fab 7H module (450k/yr), funded partly by Singapore EDB loans and grants; AMF added Nov 2025 |
| Malta, New YorkFab 8 · HQ | 300mm | 14/12nm FinFET, 22FDX, RF-SOI, silicon photonics | ~370k | CHIPS-funded expansion and a planned new fab; packaging & photonics center; two Japan-funded fabs (~900k/yr each, first in 2029) |
| Burlington / Essex Jct., VermontFab 9 · ex-IBM | 200mm | SiGe, RF, GaN | — | CHIPS modernization; GaN conversion; SiGe output increasing |
| Chinapartner foundry | — | Automotive-grade CMOS and BCD under GF process and quality control | — | “China-for-China” agreement (2025); not wholly owned by GF |
* Thousands of 300mm-equivalent wafers per year. Dresden and Malta from the FY2023 20-F; Singapore from the FY2022 20-F. Site totals are no longer broken out in the latest filing.5,6,22
U.S. investment program
In June 2025 GF raised its U.S. plan to $16B over ten-plus years: $13B to expand and modernize Malta and Vermont, plus $3B of R&D in packaging, silicon photonics and GaN.18 Public support behind it includes up to $1.5B in CHIPS direct funding (plus $75M for packaging), $570M from New York State, the 25% investment tax credit, and letters of intent for $300M (photonics) and $375M (quantum).4,1 The October 2026 Japan initiative adds up to $21B of third-party capital for two more Malta fabs, with $955M of the CHIPS award redirected.16
Financials & operating results
Revenue peaked in 2022 during the chip shortage, fell through the 2023–24 inventory correction, and is now growing again on data-center demand while margins recover.
Gross margin rose from 15% in 2021 to 28% in 2023 as long-term agreements reset prices. It dipped to about 25% in 2024–25 as utilization fell and prices softened, then climbed back to 28.3% IFRS (29.9% non-IFRS) in Q2 2026 on a richer mix, lower depreciation and cost cuts. 2024’s net loss reflects a $935M impairment; 2025 returned to $888M of net income. Annual free cash flow has stayed positive, which has funded debt repayment, acquisitions, buybacks and, from July 2026, a dividend.
Annual revenue
Margins
| $ millions | 2021 | 2022 | 2023 | 2024 | 2025 |
|---|---|---|---|---|---|
| Revenue | 6,585 | 8,108 | 7,392 | 6,750 | 6,791 |
| YoY growth | +36% | +23% | −9% | −9% | +1% |
| Gross margin | 15.4% | 27.6% | 28.4% | 24.5% | 24.9% |
| Operating margin | n/a | 14.4% | 15.3% | −3.2% | 11.7% |
| Net income | (254) | 1,446 | 1,018 | (262) | 888 |
| Adj. EBITDA (non-IFRS) | n/a | ≈3,090 | ≈2,800 | 2,475 | 2,357 |
| Operating cash flow | n/a | n/a | n/a | 1,722 | 1,731 |
| Adj. free cash flow | n/a | n/a | n/a | 1,107 | 1,157 |
| Wafers shipped (k, 300mm-eq.) | ~2,400 | ~2,500 | ~2,200 | 2,124 | 2,345 |
n/a = not collected for this overview. 2021 growth computed from 2020 revenue of $4,851M. 2022 EBITDA derived from the reported 38.1% margin; 2023 as reported (rounded). 2024 includes a $935M impairment. Wafer counts before 2024 are rounded figures from annual reports.
Quarterly revenue and gross margin
| $ millions | Q1’25 | Q2’25 | Q3’25 | Q4’25 | Q1’26 | Q2’26 | Q3’26 guide |
|---|---|---|---|---|---|---|---|
| Revenue | 1,585 | 1,688 | 1,688 | 1,830 | 1,634 | 1,786 | 1,885 ±25 |
| Gross margin (IFRS) | 22.4% | 24.2% | 24.8% | 27.8% | 27.6% | 28.3% | 29.5% ±1.0 |
| Gross margin (non-IFRS) | — | 25.2% | 26.0% | 29.0% | 29.0% | 29.9% | 30.5% ±1.0 |
| Net income | 211 | 228 | 249 | 200 | 104 | 167 | — |
| Diluted EPS (non-IFRS) | — | 0.42 | 0.41 | 0.55 | 0.40 | 0.46 | 0.51 ±0.05 |
| Adj. free cash flow | 165 | 277 | 451 | 264 | 233 | (3) | — |
| Wafers shipped (k) | 543 | 581 | 602 | 619 | 579 | 625 | — |
Q1 2025 net income, gross margin, free cash flow and wafers are derived from six-month and full-year totals. Q2 2026 free cash flow turned negative as capex rose to $411M. Q1 2026 net income was held down by $81M of tax expense, partly from currency effects on German deferred taxes.
Balance sheet, 30 Jun 2026
- $3.3B cash & marketable securitiesDown from $4.0B at year-end after $440M for ARC and $400M of buybacks.
- $1.1B debtMostly a Singapore EDB loan at 1.4% maturing 2041; $1.0B revolver undrawn.
- $11.9B equity · $16.9B total assetsGoodwill and intangibles $1.9B after the IP deals.
Capital returns
- $500M buyback authorized (Feb 2026)$300M used buying from Mubadala in March at $40.85; $100M in the open market; about $100M left at 30 Jun.
- First dividend: $0.12 per quarterPaid 14 Jul and 9 Oct 2026.
- Share count548.8M at 30 Jun 2026, down from 555.9M at year-end, before any new shares for the Commerce stakes.
Market context: shares closed at $48.76 on 15 Oct 2026 (market value about $26.8B), down from a record $92.55 on 26 May after the quantum launch and Investor Day. The 52-week range is $32.02–$92.55.45,46,48
Industry analysis
Foundry is in a two-speed upcycle. AI accelerators keep leading-edge capacity sold out and lift total foundry revenue about 25% in 2026. Mature nodes, GF’s market, are only now tightening after a two-year inventory correction, and they face a wave of new Chinese capacity from 2027.
The leading edge is where the money has gone. Nodes of 28nm and larger fell from 54% of pure-play foundry revenue in 2021 to about 36% in 2025, while their dollar revenue barely moved. GF competes almost entirely in that flat pool and the 12–20nm band just above it. Its growth case therefore rests on taking a larger share of the specialty niches inside it (RF, silicon photonics, SiGe, power, embedded memory) rather than on the pool itself growing quickly.
| Measure | 2025 | 2026F | Growth and context |
|---|---|---|---|
| Semiconductors, total (WSTS) | $796B | $1,511B | +90% in 2026, almost all from memory (+250%). Forecast $1.91T in 2027.32 |
| Logic / Analog (WSTS) | $300B / $87B | $411B / $95B | Logic +37%, analog +10%: the AI-heavy segment grows almost four times faster.32 |
| Foundry revenue (TrendForce) | ~$175B | $218.8B | +24.8% in 2026; TSMC ~+32%. Top-10 foundries earned $169.5B in 2025 (+26%).30,31 |
| Pure-play foundry (Counterpoint) | >$165B | — | 12% CAGR 2021–25; 7nm and below now more than half of revenue.33 |
| “Foundry 2.0” (Counterpoint) | $320B | — | Broader definition including packaging/test, masks and non-memory IDMs; +16%.34 |
| GF served market (GF) | ~$75B | — | ~$120B by 2030, ~10% CAGR; optical-networking wafers ~40% CAGR.38 |
2025 foundry total is implied from TrendForce’s 2026 forecast and growth rate. “—” = no comparable published forecast found.
Pure-play foundry revenue by node
What stage of the cycle are we in?
Long-term agreements, prepayments and price rises; GF revenue peaks at $8.1B.
Mature-node utilization below 80%, prices slip; GF revenue −17% from peak.
Leading edge sold out; mature nodes flat, ASPs still falling (GF −10%).
8-inch utilization ~90%, TSMC and Samsung shrinking 8-inch; SMIC, Hua Hong and Nexchip raise prices ~10%; GF raised prices for 2027.
New 12-inch mature fabs start depreciating and need filling; generic planar nodes most exposed.
Utilization: UMC 85%, SMIC 93.7%, Hua Hong 102.8% in Q2 2026; GF high-80s. Offsetting headwind: the memory price spike is cutting smartphone and PC builds.35,36,37,40
How the industry evolves from here
Every AI rack needs optical links (silicon photonics, SiGe drivers and TIAs) and many more power chips (BCD, GaN). GF expects about 70% of data-center links to be optical by 2030.
For GF: strongest tailwindNearly 70% of new 12-inch mature-node capacity is Chinese; the visible pipeline at major merchant foundries, mostly Chinese, approaches 200,000 12-inch wafers a month. Domestic demand is protected and surplus could be exported at low prices.
For GF: pricing risk in generic nodes; partly hedged by its China-for-China partnerTSMC and Samsung are cutting 8-inch lines, and TSMC plans to trim 12-inch mature capacity over one to three years. Customers left behind need a non-Chinese home.
For GF: share opportunityCHIPS Act, EU Chips Act and now Japanese capital pay for non-Asian capacity. Automakers and defense buyers increasingly ask for dual sourcing outside Taiwan and China.
For GF: subsidized growth and pricing supportSources: TrendForce via AnySilicon (May 2026), TrendForce News (Mar 2026), company data compiled by Leon Liao (2026), GF Investor Day.35,36,37,38
Competitive landscape
| Company | Base | Focus | Share 2Q26 | Gross margin | Fwd P/E | EV/EBITDA |
|---|---|---|---|---|---|---|
| TSMC | Taiwan | Leading edge, advanced packaging | 72.5% | 65.9% | 19.3x | 16.4x |
| Samsung Foundry | Korea | Leading edge, inside an IDM | 5.9% | n/a | n/a | n/a |
| SMIC | China | Mature + 7nm-class for domestic market | 5.4% | 21.8% | 44.9x | 19.6x |
| UMC | Taiwan | 28/22nm logic, specialty; closest pure-play peer | 3.9% | 30.6% | 21.9x | 14.3x |
| GlobalFoundries | U.S. | RF, FD-SOI, SiPh, SiGe, power; U.S./EU/Singapore fabs | 3.2% | 28.3%* | 22.5x | 12.7x |
| Hua Hong | China | Power, eNVM, analog | ~2.5% | 14.1% | 87.0x | 46.6x |
| Tower Semiconductor | Israel | Analog, RF, SiGe, SiPh; direct SiPh rival | ~0.9% | 26.9% | 40.6x | 37.7x |
Shares: TrendForce top-10 ranking (Hua Hong Q1’26, Tower Q4’25). Margins TTM; multiples from StockAnalysis.com, 15 Oct 2026 (SMIC 25 Sep, Hua Hong 21 Aug). * GF Q2 2026 IFRS.20,31,46
The valuation spread is the most telling part of this table. Tower, the peer most exposed to silicon photonics, trades at about 13x sales and 38x EBITDA; GF trades at 3.6x and 13x. Investors pay up for photonics exposure but still value GF mainly as a utilization-driven mature-node foundry. Closing part of that gap is the core of the bull case.
Growth drivers, risks & outlook
After four flat years (2021–25 revenue CAGR +1%), GF’s growth now comes from a narrow set of AI-linked businesses while smartphones, still a third of revenue, shrink.
Where Base-case growth comes from, 2025A → 2030E
Growth drivers
- Optical networking (silicon photonics + SiGe)Comms Infrastructure & Datacenter rises from 11% to 26% of revenue in our Base case. GF works with 4 of the top 5 transceiver makers and 40+ customers; SiGe is sold out through 2027; near-packaged optics ramps in 2027 and co-packaged optics in 2028. Target: ~$1B silicon photonics run-rate exiting 2028, ~$2B by 2030.
- Automotive$1.41B in 2025 (+17%). More radars (5–8 per car by 2030), sensors and zonal MCUs; 2025 design wins tripled; GM signed a direct supply deal in October.
- IoT and “physical AI”Mid-teens growth target from connected devices needing embedded memory, wearables and medical sensors.
- Technology services and IPMIPS and ARC processor IP plus custom design; target ~$1B run-rate by 2030. Licence revenue carries far higher margins than wafers.
- Power for AI data centersBCD, GaN and integrated voltage regulators; GF sees ~$1B of incremental power revenue by 2030.
- Japan-fab feesTechnology, construction and operating fees from 2027 with little GF capital, since the U.S.–Japan vehicle owns the fabs; ~$50M in 2027, EPS +$0.50–0.75 long term.
- Price and utilizationPrice rises implemented in Q2 hit revenue from 2027. Utilization is in the high-80s with ~10 points of headroom in existing fabs.
Risks
- Smartphone squeezeMemory costs are cutting handset builds; SMD is guided down low-teens in 2026. A longer squeeze drags the largest segment.
- Chinese overcapacity, 2027–29If new Chinese fabs export surplus, mature-node ASPs fall again, as they did by 10% in 2025.
- Photonics competitionTower, TSMC and others are chasing the same optical sockets; a lost CPO platform would undercut the $2B target.
- Margin executionThe 30% → 40% gross-margin bridge needs mix, utilization and services to land at once; each point of gross margin is worth about $0.13–0.15 of EPS at 2028 revenue.
- Customer concentrationTop ten customers took 63% of 2025 wafer volume.
- Dilution and overhangCommerce stakes add ~5% to the share count; Mubadala (~77%) sold shares in March and management says it welcomes a larger float.
- Strings and controlsGrant milestones restrict capital returns; material weaknesses in financial controls were reported for 2025.
- VolatilityBeta ~1.8; the stock traded between $32 and $93 in the past year.
Management’s outlook
| Metric | 2026 guidance | Exit 2028 | Long term | Our Base case |
|---|---|---|---|---|
| Revenue growth | Q3 $1.885B ±25M; FY ~+7% | — | 10–12% CAGR through cycle | 11.5% CAGR 2025–30 |
| Comms Infra & Datacenter | +50–60% | SiPh ~$1B run-rate | 30%+ CAGR; SiPh ~$2B (2030) | 32.5% CAGR |
| Gross margin (non-IFRS) | ~30% for FY / exit | ~40% | ~45% | 36.1% FY2028, 40.3% FY2030 (IFRS) |
| Operating margin (non-IFRS) | ~17% (Q3) | ~25% | ~35% | 24.0% FY2028 |
| Non-IFRS EPS | Q3 $0.51 ±0.05 | $4.00 annualized | $6.00 | $3.34 FY2028, $4.93 FY2030 |
| Net capex / FCF | 15–20% of revenue; FCF ~10% | — | Capex ~20%; FCF 10%+ | FCF 7.7% (2026) → 20.1% (2030) |
| Capital return | $0.12 quarterly dividend | — | Up to 50% of adj. FCF | 50% of prior-year FCF |
Sources: Q2 2026 call; Investor Day presentation; CFO at TD Cowen conference, May 2026.38,40,42
Why management anchored these numbers
Revenue at 10–12% sits just above the market. GF’s served market is projected to grow ~10% a year to 2030. Management needs only modest share gains, concentrated in optical networking where its served market grows ~40%, while it models smartphones flat. Leaving its weakest segment out of the growth case makes the headline more defensible.
The margin bridge leans on levers GF controls. Roughly 5 of the 10 points from ~30% to ~40% come from mix alone. The rest comes from filling ~10 points of idle capacity in existing fabs, higher-margin services and IP, and productivity. Pricing and falling depreciation (D&A dropped from $1.57B in 2024 to $1.31B in 2025) are upside not explicitly counted.
“Exit 2028” is a run-rate, and it is ambitious. $4.00 of annualized EPS works out to roughly a $10.4B revenue run-rate at a 25% operating margin and a 15% tax rate on ~560M shares. That implies roughly 13–15% annual growth from 2025 to late 2028, faster than the 10–12% headline. Our Base case reaches about $4 of EPS in 2029, a year late.
Capital intensity was set before the Japan deal. The ~20% long-term capex target predates the October agreement, under which the U.S.–Japan vehicle owns the new fabs. If GF’s own capex eases, free cash flow could beat the 10% floor; we keep capex at 15–18% of revenue to stay cautious.
Financial model & valuation
How the model is built
Revenue is forecast by end market from the FY2025 base, with 2026 anchored to first-half actuals and Q3 guidance. Gross margin, R&D and SG&A are scenario inputs calibrated against management’s targets; Japan-fab fees are a separate high-margin line. A full balance sheet and cash flow statement tie out every year, including the unwinding of customer prepayments, the dividend, buybacks at 50% of free cash flow, and the ~28M shares expected to be issued to the Commerce Department. The DCF runs to 2035, fading growth to a terminal rate and margins to a terminal level, and treats share-based pay as a real cost.
| Driver | Bear | Base | Bull (≈ management) |
|---|---|---|---|
| Revenue CAGR 2025–30 | 5.2% | 11.5% | 15.4% |
| Comms Infra & DC CAGR | 20.9% | 32.5% | 41.3% |
| Smartphones (2027–30 a year) | −3% to 0% | +2% | +4–5% |
| Gross margin 2028 / 2030 (IFRS) | 30.9% / 32.4% | 36.1% / 40.3% | 39.2% / 44.2% |
| Japan-fab fees 2030 | $150M | $320M | $400M |
| Terminal EBIT margin / growth | 15% / 2.5% | 25% / 3.0% | 30% / 3.5% |
| What has to happen | Chinese price war, SiPh share loss, mobile keeps shrinking | Targets land about two years late | Investor Day plan delivered on time |
Base-case revenue by end market
| 2025A | 2026E | 2027E | 2028E | 2029E | 2030E | |
|---|---|---|---|---|---|---|
| Revenue | 6,791 | 7,285 | 8,234 | 9,322 | 10,494 | 11,681 |
| Growth | 0.6% | 7.3% | 13.0% | 13.2% | 12.6% | 11.3% |
| Comms Infra & DC share | 11% | 16% | 19% | 22% | 24% | 26% |
| Gross margin (IFRS) | 24.9% | 28.8% | 32.8% | 36.1% | 38.5% | 40.3% |
| Non-IFRS operating margin | — | 17.6% | 20.9% | 24.0% | 26.4% | 28.5% |
| Net income | 888 | 712 | 1,104 | 1,519 | 1,976 | 2,449 |
| Non-IFRS EPS | $1.72 | $1.99 | $2.66 | $3.34 | $4.12 | $4.93 |
| Free cash flow | 1,157 | 564 | 834 | 1,295 | 1,815 | 2,344 |
| FCF margin | 17.0% | 7.7% | 10.1% | 13.9% | 17.3% | 20.1% |
2026E non-IFRS EPS $1.99 vs consensus $1.96; 2027E $2.66 vs consensus $2.63 (StockAnalysis, 23 analysts).44 Free cash flow dips in 2026 as capex rises to ~18% of revenue and customer prepayments unwind.
Non-IFRS EPS by scenario
Discount rate
| Risk-free (10-yr Treasury) | 5.19% |
|---|---|
| Beta (raw 1.76, used) | 1.40 |
| Equity risk premium | 4.5% |
| Cost of equity | 11.5% |
| Debt weight / after-tax cost | 5.8% / 4.7% |
| WACC | 11.1% |
A 5.2% risk-free rate makes this WACC higher than most published GF models; each point lower adds about $5–7 a share.
Base-case DCF bridge
| PV of free cash flow, H2 2026–2035 | 9,972 |
|---|---|
| PV of terminal value | 14,399 |
| Enterprise value | 24,371 |
| Net cash (30 Jun 2026) less NCI | 1,569 |
| Equity value | 25,940 |
| Diluted shares incl. Commerce stakes (M) | 584.5 |
| Value per share | $44.38 |
Terminal value is 59% of EV and implies 6.4x 2035 EBITDA.
Base-case value per share: WACC × terminal growth
| g \ WACC | 9.5% | 10.0% | 10.5% | 11.0% | 11.5% | 12.0% | 12.5% |
|---|---|---|---|---|---|---|---|
| 2.0% | $51 | $48 | $45 | $42 | $40 | $37 | $35 |
| 2.5% | $53 | $50 | $46 | $43 | $41 | $38 | $36 |
| 3.0% | $56 | $52 | $48 | $45 | $42 | $40 | $37 |
| 3.5% | $59 | $54 | $50 | $47 | $44 | $41 | $39 |
| 4.0% | $63 | $57 | $53 | $49 | $45 | $42 | $40 |
Valuation range
What the price implies
At $48.76, GF trades at about 18.5x 2027 consensus EPS, in line with UMC and TSMC and far below Tower. On management’s $4.00 exit-2028 EPS it is about 12x. Our Base DCF of $44.38 is 9% below the price, and the probability-weighted value is $43.69. The market is therefore paying for our Base case plus a partial chance that the Investor Day plan lands on time, which our Bull case values at $66.14.
Peer multiples give a higher range ($47.88–$79.80 on 18–30x 2027E EPS) because peers carry richer growth expectations, and the analyst mean target is $74.68. The gap between those and our DCF comes mostly from the discount rate and from capex staying high through 2030.
What would change the view: evidence that gross margin is on the 40%-by-2028 path (Q3 results on 4 Nov 2026 and the 2027 pricing reset); a co-packaged-optics production win; definitive Japan agreements confirming fee economics; or, on the downside, Chinese mature-node prices turning down again in 2027.
Photos & video
 ▶ 17:00
 ▶ 14:55
 ▶ 5:54
 ▶ Watch
 ▶ 37:40
 ▶ Watch
 ▶ 3:11
Sources
- GF Q2 2026 results release (SEC 6-K), 5 Aug 2026
- GF interim financial statements & MD&A, H1 2026 (SEC 6-K)
- GF Q4 and FY2025 results release (SEC 6-K), 11 Feb 2026
- GF Annual Report on Form 20-F, FY2025
- GF Form 20-F, FY2023
- GF Form 20-F, FY2022
- GF Q4 and FY2022 results release, 14 Feb 2023
- GF Q4 and FY2023 results release
- Wikipedia: GlobalFoundries (company history)
- GF leadership and board of directors
- Converge Digest: GlobalFoundries names Tim Breen as CEO, Feb 2025
- SEC 6-K: Niels Anderskouv resignation, Feb 2026
- SEC 6-K: Closing of Mubadala secondary offering and repurchase, Mar 2026
- GF: Patent lawsuits against Tower Semiconductor, 26 Mar 2026
- GF: Quantum Technology Solutions launch, 21 May 2026
- GF (GlobeNewswire): Two new New York fabs under U.S.–Japan initiative, 14 Oct 2026
- Benzinga: Why is GlobalFoundries stock surging, 14 Oct 2026
- Reuters (via Business Reporter): GF boosts investment plans to $16B, Jun 2025
- VTDigger: GF to invest $16B in Vermont and New York, Jun 2025
- TrendForce: Top-10 foundry revenue, Q2 2026 (9 Sep 2026)
- Yahoo Finance: GF Q2 2026 earnings call highlights
- TrendForce News: GF partners with Chinese foundry, Aug 2025
- Verdict: GF outlines €1.1B Dresden expansion (Project SPRINT)
- GF: Q3 2026 conference call announcement
- GF Form 20-F, FY2021
- Semiconductor Engineering: GlobalFoundries entity profile
- Europractice: GlobalFoundries technology overview (PDF)
- Morningstar: GFS company profile (employees)
- GuruFocus: GFS summary and event prices
- TrendForce: 2026 foundry revenue to grow 24.8% (19 Mar 2026)
- TrendForce: 4Q25 top-10 foundry ranking and FY2025 total (12 Mar 2026)
- WSTS Spring 2026 semiconductor market forecast (PDF)
- EE Times Asia (Counterpoint): pure-play foundry revenue and node mix, 2025
- DIGITIMES (Counterpoint): Foundry 2.0 market $320B in 2025
- AnySilicon (TrendForce): 8-inch cuts and mature-node price increases, May 2026
- TrendForce News: Nexchip, SMIC, Hua Hong price hikes, Mar 2026
- Leon Liao (Substack): China’s next wave of mature-node capacity, 2026
- GF Investor Day 2026 presentation (7 May 2026)
- GF: Investor Day release, long-term roadmap and first dividend
- Motley Fool: GF Q2 2026 earnings call transcript
- Investing.com: GF Q4 2025 earnings call transcript
- Yahoo Finance (MarketBeat): CFO maps path to 40% margins, May 2026
- Yahoo Finance: Japan-backed fab economics for GF, Oct 2026
- StockAnalysis.com: GFS analyst forecasts and price targets
- MarketBeat: Wedbush reaffirms Neutral; 52-week range, 15 Oct 2026
- StockAnalysis.com statistics: GFS, TSM, UMC, TSEM, SMIC, Hua Hong
- FRED: 10-year Treasury constant maturity (DGS10)
- Motley Fool: why GF stock rallied, 24 May 2026
Compiled 16 Oct 2026 for research purposes; not investment advice. Non-IFRS figures are company-defined. Photos are from Wikimedia Commons under the licences stated in each caption; video thumbnails link to the original YouTube pages.